
Interdisciplinary research lab in data visualization and HCI at the University of Edinburgh.
Publications - Teaching - News
Outreach - Get in touch
Follow us on LinkedIn



Vistorian
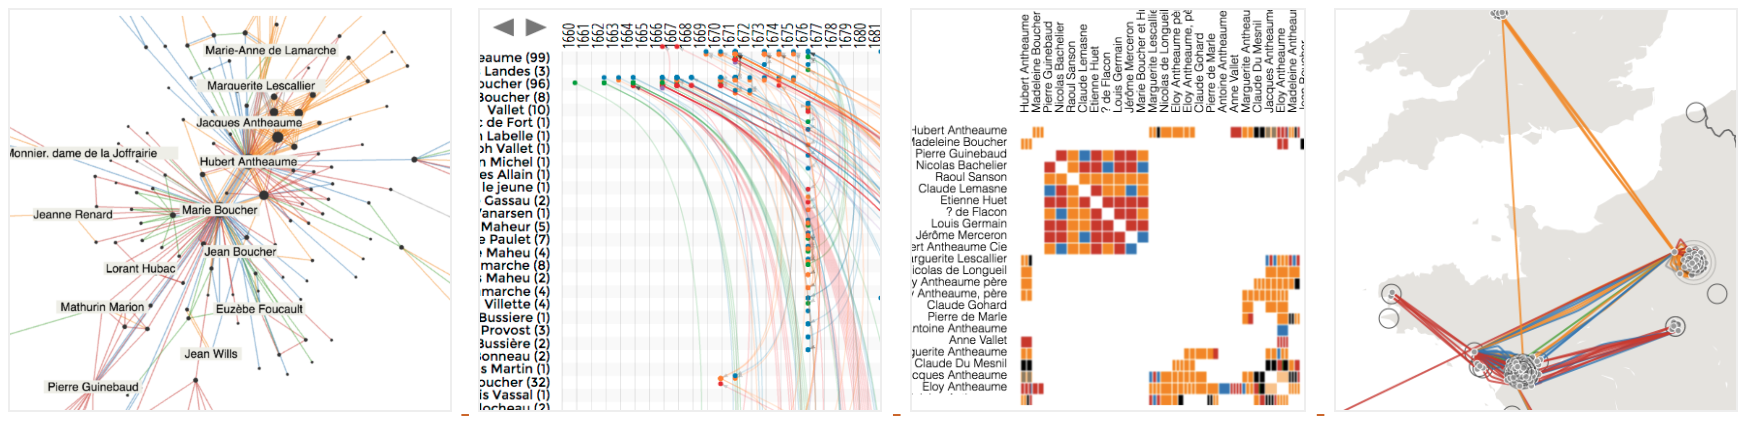
The Vistorian is an online tool for interactive exploration of dynamic, multivariate, and geographic networks. Main features include a wide range of different interactive network visualizations: node link diagrams, side-by-side views and parallel use of any of these visualizations. and a geocoding service that obtains geographic locations from placenames in your dataset.
People involved
- Benjamin Bach (Google Scholar)
- Xinhuan Shu
- Alexis Pister
- Nathalie Henry Riche
- Roland Fernandez
- Emmanoulis Giannisakis
- Bongshin Lee
- Jean-Daniel Fekete
Publications
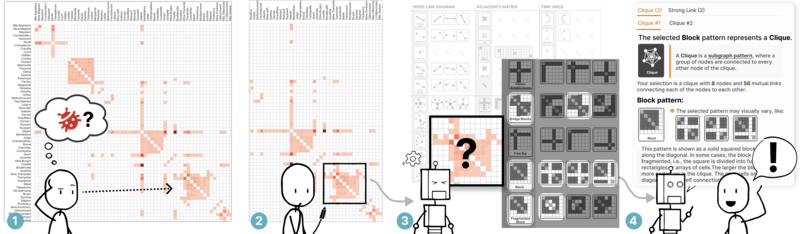
Does This Have a Particular Meaning? Interactive Pattern Explanation for Network Visualizations: Xinhuan Shu, Alexis Pister, Junxiu Tang, Fanny Chevalier, and Benjamin Bach. IEEE Transactions on Visualization and Computer Graphics (TVCG, IEEE VIS 2024). (2024).
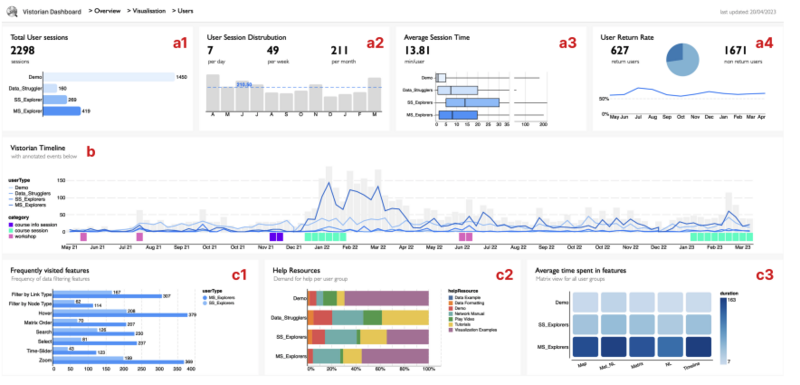
Show Me My Users: A Dashboard Visualizing User Interaction Logs: Jinrui Wang, Mashael AlKadi, Benjamin Bach. IEEE Transactions on Visualization and Computer Graphics (TVCG, IEEE VIS, 2021) short paper. (2023).
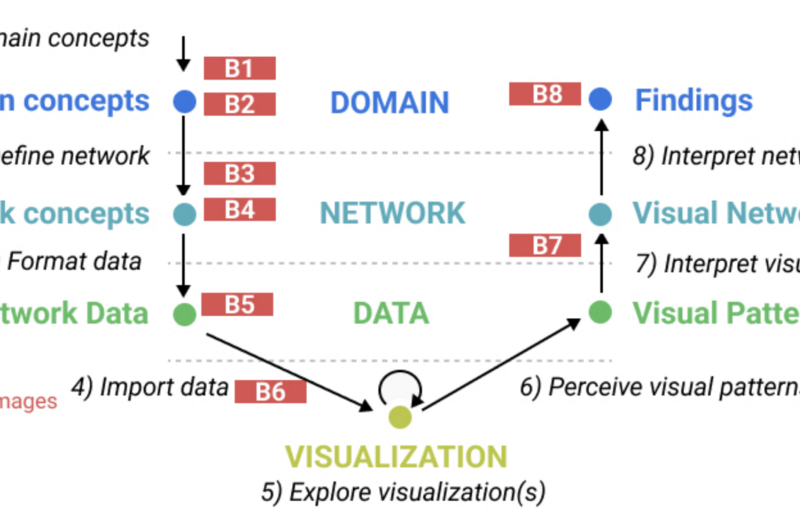
Understanding Barriers to Network Exploration with Visualization: A Report from the Trenches: Mashael AlKadi, James Scott-Brown, Vanessa Serrano, Jean-Daniel Fekete, Catherine Plaisant, Uta Hinrichs, Benjamin Bach. IEEE Transactions on Visualization and Computer Graphics (TVCG, IEEE VIS, 2021). (2023).