Interdisciplinary research lab in data visualization and HCI at the University of Edinburgh.
Publications - Tools - Teaching
News - Resources - Outreach
Work with us
Follow us on LinkedIn

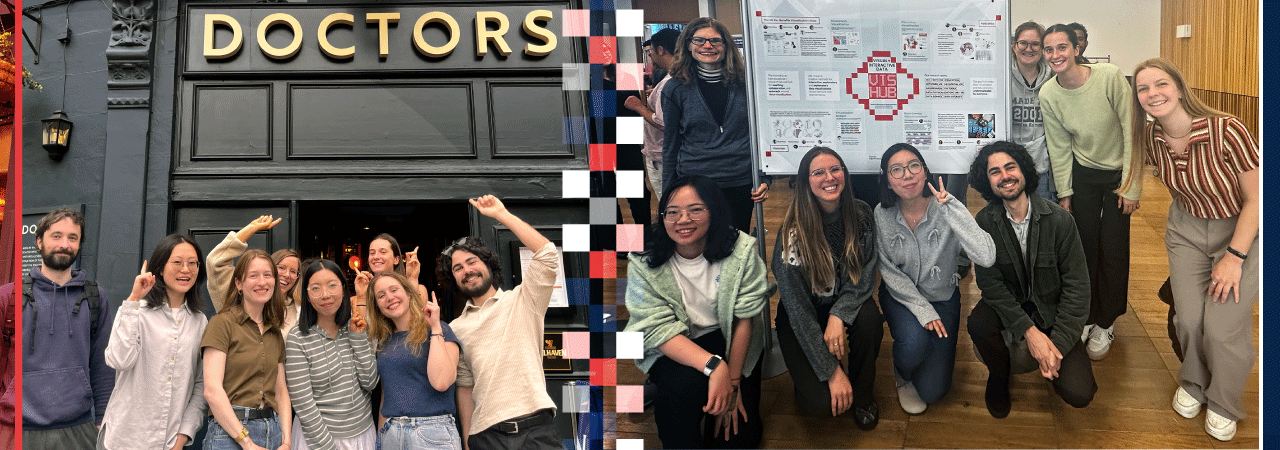
The VisHub is an interdisciplinary research lab and hub for teaching, collaboration, and outreach around data visualization hosted by the Institute for Design Informatics and the School of Informatics at the University of Edinburgh. We research creative methods for interactive, exploratory and explanatory data visualizations across domains and environments. Our goal is to make data visualization and data analytics understandable by everyone.
News
- Jul 2025: Sarah Schöttler passed her PhD Viva and is joining the Visualization Cluster at TU Eindhoven as an Assistant Professor. Congratulation!
- May 2025: Dushani Perera, Dorsey Kaufmann, Uta Hinrichs and team had their workshop accepted in Eurovis 2025, titled “Grasping Data Through Play: Exploring Co-Design Activities for Children’s Engagement with Personal Data”.
- May 2025: Sarah Dunn won the first place prize at the CHI student competition for her work on Personalised Health Data comics.
- May 2025: Hiring a data visualization designer/developer for joining the World Bank’s B-ready team in 2025 Summer Internship.
- Sept 2024: Welcoming Dorsey Kaufmann in our group!
Projects
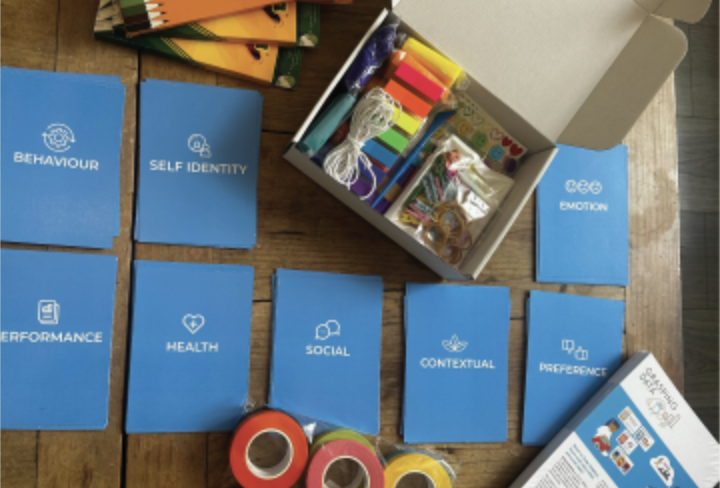
Grasping Data: This project collaborates with children, their educators, and parents to co-create tangible representations of personal data that children can touch, explore, talk about, and learn from. Through hands-on activities, the project aims to empower young children to understand and benefit from their personal data.
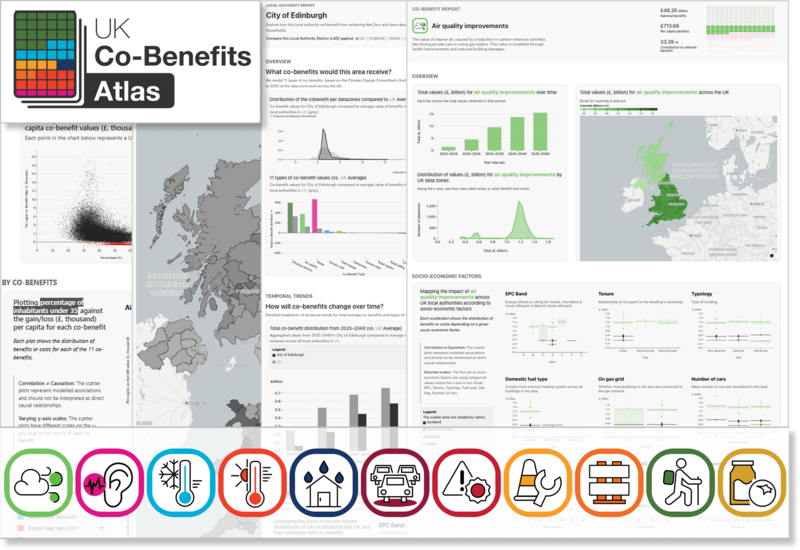
UK Co-Benefit Atlas: This project builds an interactive visualization atlas to represent data about reaching NetZero in the UK. Data about socio-economic benefits is from the Edinburgh Climate Change Institute.
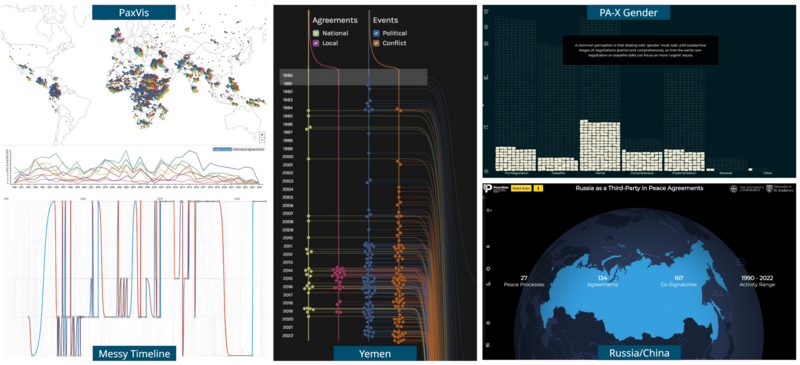
Visualizations in Peace & Conflict: PeaceRep is a leading developer of PeaceTech and peace data. Our innovative datasets,tools, and visualisations support adaptive management of peace and transition processes.
Community Activities
Join our mailing list focusing on data visualization in Edinburgh, Scotland, the UK and beyond. The group is open to everyone and aims to share news, events, discussions, jobs, etc.
Online Course Data Visualization for Professionals
A 10-week long online course on data visualization for working professionals. The course is build around lectures, live tutorials, talks, Q&A sessions, individual check-in sessions with the course organizers, and project work. Each participant can join with their own data set and develop their own visualization project along the structured guidance and feedback along the 10 weeks.
The data fair is an event that brings together our Master students in Design Informatics from the University of Edinburgh (School of Informatics and College of Art) and external partners (you!). We invite external partners to share their real-world data with our students, collaborate on data analysis and visualization, and ideally end up with a project that you can share publicly.
The monthly data vis meetup in Edinburgh, co-organized by the VisHub, open to everyone and featuring talks about visualization. Currently 1200+ members.
The Chart Clinic is an open drop-in session, once per month, for everyone to ask for advice on their visualizations. The clinic is staffed alternating with different staff from the VisHub.