Interdisciplinary research lab in data visualization and HCI at the University of Edinburgh.
Publications - Tools - Teaching
News - Resources - Outreach
Work with us


Dashboards
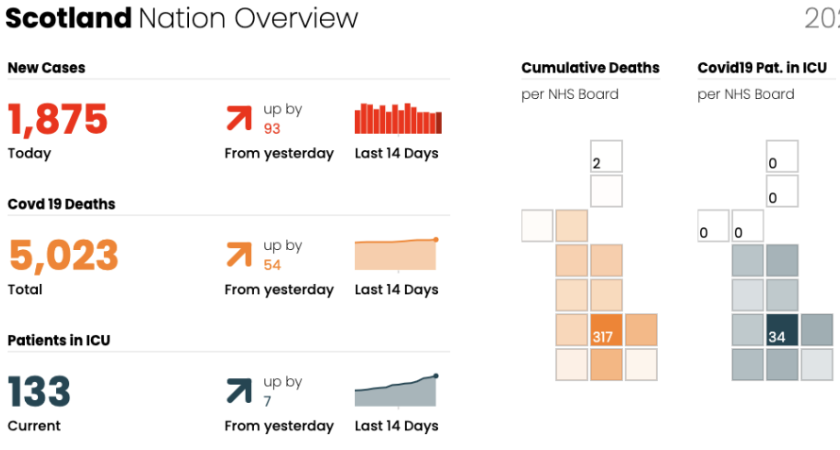
Dashboards offer a curated lens through which people can view large and complex data sets at a glance. They combine visual representations and other graphical embellishments to provide layers of abstraction and simplification for numerous related data points, so that viewers get an overview of the most important or relevant information, in a time-efficient way. Their ability to provide insight at a glance has led to dashboards being widely used across many application domains, such as business, nursing and hospitals, public health, learning analytics, urban analytics, personal analytics, energy, and public communication.
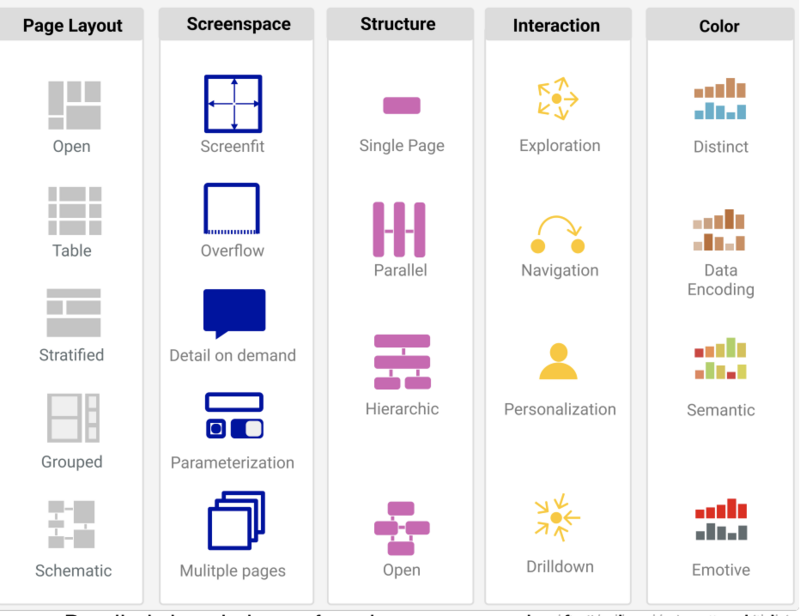
However, there is little to no research what makes a dashboard effective and how to design and prototype dashboards. Dashboard design is admittedly not straightforward: designers have access to numerous data streams, which they can process, abstract, or simplify as they see fit; they have a wide range of visual representations at their disposal; and they can structure and present these visualizations in numerous ways, to take advantage of the large screens on which they are viewed. there is a timely need for guidance about dashboard design—especially as dashboards are increasingly being designed for a wider non-expert audience by designers without a background in visualization or interface design.
People involved
- Benjamin Bach (Google Scholar)
- Devanjan
Publications
Dashboard Design Patterns: Benjamin Bach, Euan Freeman, Alfie Abduhl-Rahman, Cagatay Turkay, Saiful Khan, Yulei Fan, Min Chen . IEEE Transactions on Visualization and Computer Graphics (TVCG, IEEE VIS, 2021). (2023). [WEB] Best paper honorable mention
Propagating Visual Designs to Numerous Plots and Dashboards: Saiful Khan, Phong H. Nguyen, Alfie Abdul-Rahman, Benjamin Bach, Min Chen, Euan Freeman, Cagatay Turkay. IEEE Transactions on Visualization and Computer Graphics (TVCG, IEEE VIS, 2021). (2022).
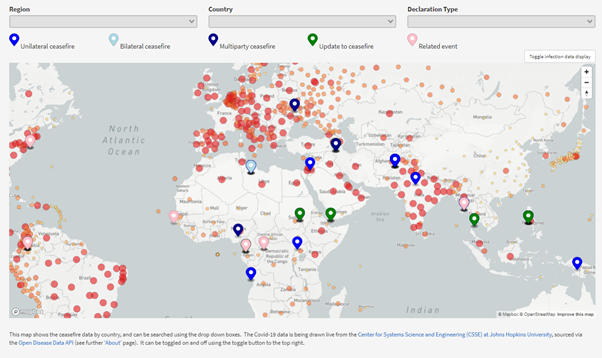
Designing an interactive real-time web-mapped dashboard to visualise conflict ceasefires data over COVID-19 infection rates: Facilities and the way ahead: Devanjan Bhattacharya, Sanja Badanjak, Christine Bell, Fiona Knaussel, Laura Wise, John Allison, Benjamin Bach. IEEE Global Humanitarian Technology. (2022).